The 2026 Super El Niño, Explained
A plain-language guide to what the 2026 Super El Niño is, when it peaks, and how it may reshape rainfall, snowpack, flooding and drought across the United States.
Source: NOAA Climate Prediction Center & IRI ENSO plume - 2026 seasonal ENSO strength outlook (probability of a "very strong" event, ONI ≥ +2.0 °C, peaking Nov 2026–Jan 2027).
What is El Niño?
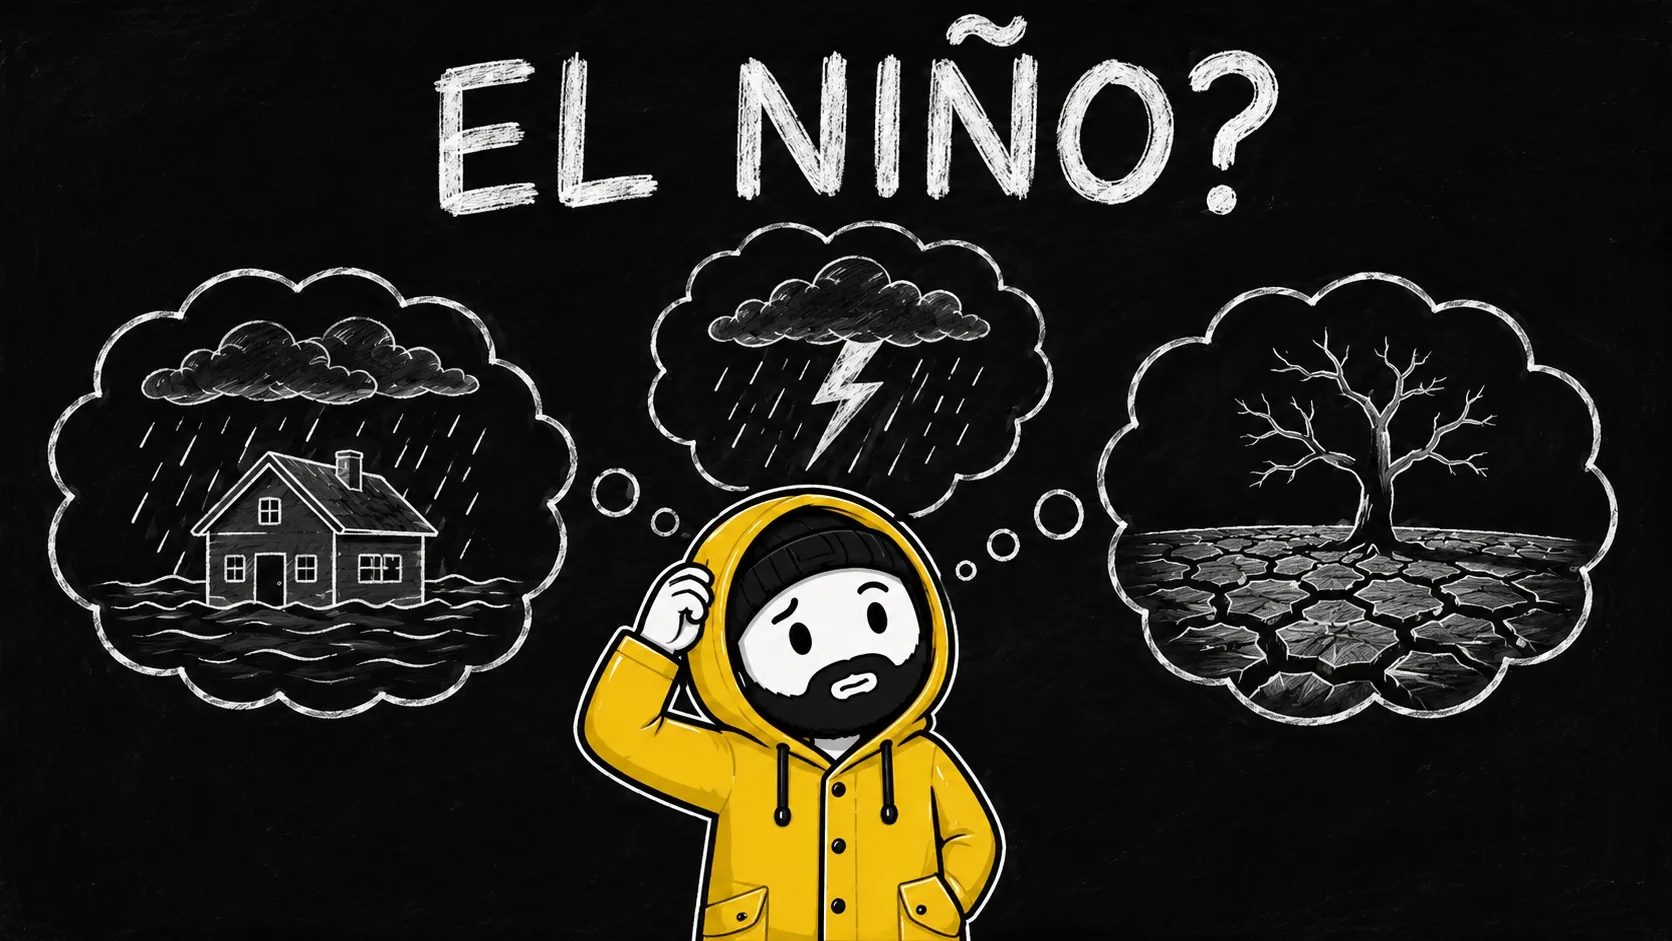
El Niño is one phase of a natural climate cycle called the El Niño–Southern Oscillation, or ENSO. Every few years, the band of ocean along the equator in the central and eastern Pacific becomes unusually warm. That warmth changes where thunderstorms form over the ocean, which in turn nudges the jet streams that steer weather across North America and much of the world. When the pattern flips the other way - with cooler-than-normal Pacific water - it’s called La Niña.
Because it shifts the storm track, El Niño doesn’t bring one kind of weather everywhere. It tends to make some regions wetter and stormier while leaving others milder and drier than normal. Its strongest, most predictable effects on U.S. weather show up in winter.
What makes an El Niño “super”?
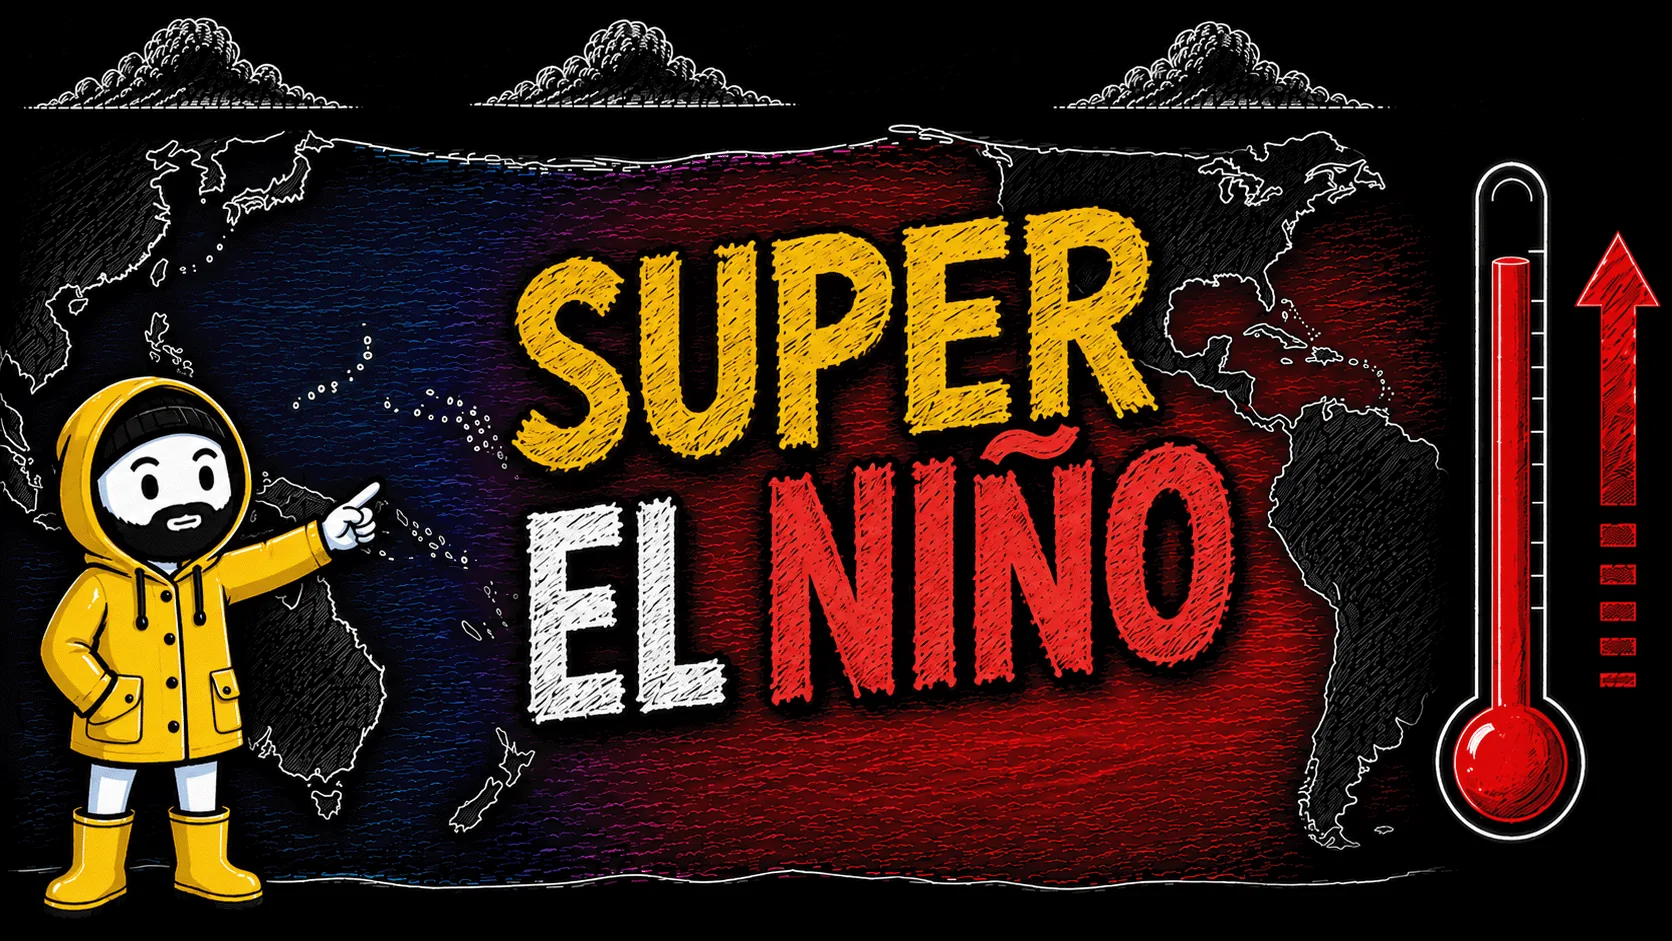
Scientists measure El Niño’s strength with the Oceanic Niño Index (ONI) - the three-month average of how far Pacific sea-surface temperatures sit above normal. A weak El Niño runs around +0.5 to +1.0°C. Once the index reaches or passes +2.0°C, forecasters call the event “very strong,” or informally, a “Super” El Niño.
That threshold is rare. Since reliable records began in 1950, only a few events have reached it - most notably the winters of 1982–83, 1997–98 and 2015–16. Each brought dramatic, and in some places destructive, weather: torrential California storms and flooding, shrunken northern snowpacks, and a warmer-than-normal winter across the northern states.
How strong is the 2026 El Niño?
Forecasters give the 2026–27 event roughly a 88% chance of reaching “very strong,” according to the NOAA Climate Prediction Center and the IRI’s model-ensemble ENSO outlook. That’s a forecast, not a settled fact - the odds are updated as new seasonal outlooks come out, and ElNinoImpact.com tracks the live strength reading using NOAA’s Oceanic Niño Index (ONI).
If it does reach that level, 2026 would join the small club of super events - which is why the potential impacts are worth understanding and preparing for now, rather than after the storms arrive.
How to prepare
Preparation looks different depending on whether your region is trending wetter or drier, but a few steps help almost everywhere:
- Sign up for local National Weather Service alerts for flash flooding, winter storms and high wind.
- In wetter regions, clear gutters, drains and storm channels, and prepare sandbags if you live below a hillside or burn scar.
- In drier, low-snow regions, plan for tighter spring and summer water supply and an earlier wildfire season.
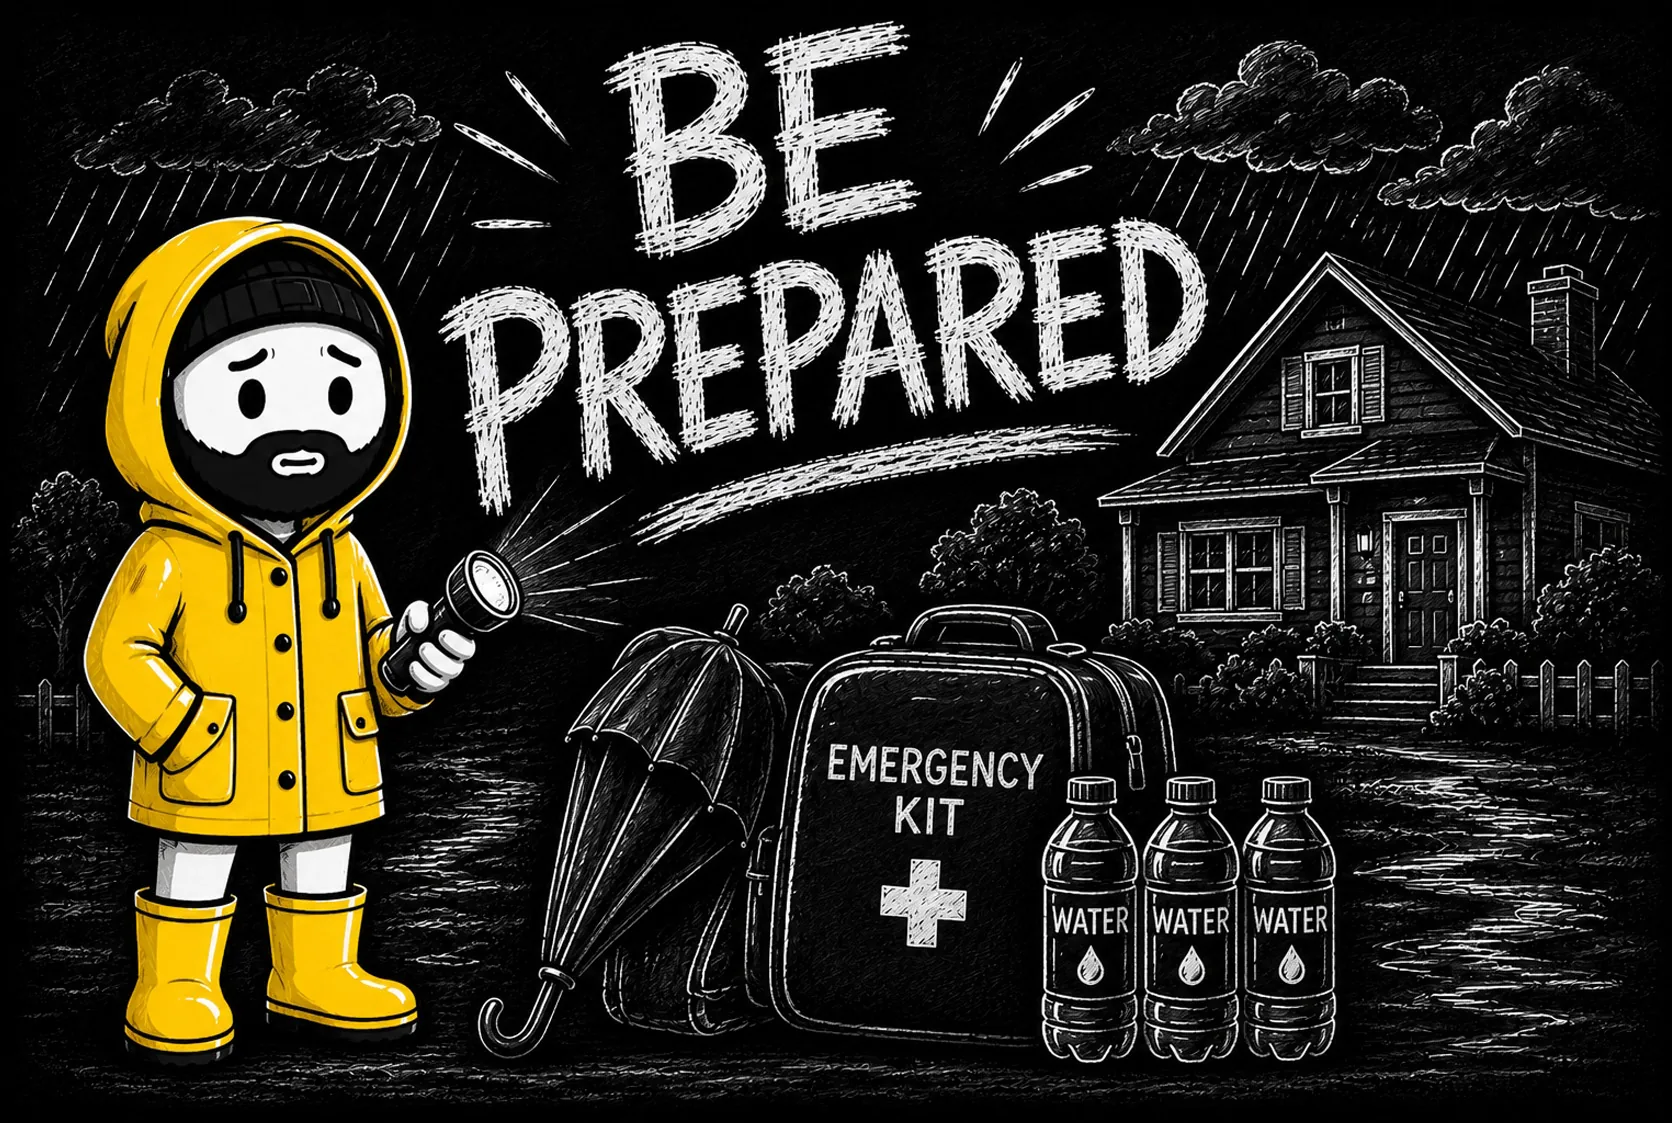
- Build or refresh a basic emergency kit - water, food, flashlight, batteries, medications and a way to charge your phone.
Your local page lists the specific hazards and a tailored checklist for your area.
As an Amazon Associate we may earn from qualifying purchases.
When will it peak?
El Niño events almost always strengthen through the fall and peak in late fall or winter. The 2026 event is forecast to peak around Nov 2026 – Jan 2027. Its effects on U.S. weather - the extra storms in the South, the quiet mild stretches in the North - are usually most pronounced from December through March, and can linger into early spring before the pattern relaxes.
How the 2026 El Niño may affect the U.S.
El Niño’s fingerprint on American winters is one of the most studied signals in climate science. Here’s the broad regional picture - pick your state for a city-by-city forecast with live weather and preparedness steps.
Southwest & California - wetter, higher flood risk
El Niño steers the Pacific storm track south over California, Arizona, Nevada and New Mexico - NOAA rates the Southwest among the most reliable wet-winter signals in the U.S. A very strong event is tied to the wettest Southwest winters on record (1982–83, 1997–98, 2015–16), raising the risk of flooding and landslides, especially below burn scars and hillsides.
Gulf Coast & Texas - wetter, cooler, winter flooding
El Niño strengthens the subtropical jet over Texas, Oklahoma, Louisiana and the wider Gulf Coast, favoring a wetter, slightly cooler winter. Saturated ground and frequent storm systems raise the risk of street and river flooding through the season.
Southeast - frequent storms, above-normal rain
The same strengthened subtropical jet brings frequent rain and storms across Georgia, the Carolinas, Alabama and Florida. NOAA’s outlook favors above-normal rainfall from October through March, with flood risk rising in low-lying coastal areas.
Pacific Northwest - milder, drier, low snowpack
El Niño pushes the wettest Pacific storms south of Washington and Oregon, favoring a warmer, drier winter. Strong events have averaged Washington Cascades snowpack near 75% of normal, meaning tighter summer water supply and earlier wildfire risk.
Great Lakes, Ohio Valley & the North - mild, low snow
El Niño winters shift the storm track south, leaving the upper Midwest, Great Lakes and Ohio Valley milder and drier than normal with below-normal snowfall - one of the most consistent U.S. ENSO signals. Expect reduced snowpack and spring water supply, with occasional sharp cold snaps still possible.
Don’t see your state? Browse every state and city →
How we source our data
Everything here is built on public, cited science - no invented numbers. Strength readings use NOAA’s Oceanic Niño Index (ONI). The “very strong” probability comes from the NOAA Climate Prediction Center and the IRI ENSO plume. Local current conditions and forecasts use the U.S. National Weather Service and Open-Meteo, and active watches and warnings come straight from the NWS alerts feed. Regional impact summaries reflect NOAA’s documented El Niño winter signals and the historical record of past super events.
Frequently asked questions
What is a Super El Niño?
A “Super” (or “very strong”) El Niño is an event where the Oceanic Niño Index - the 3-month average sea-surface temperature anomaly in the tropical Pacific - reaches or exceeds +2.0°C. Only a handful of events since 1950 have qualified, including 1982–83, 1997–98 and 2015–16.
How strong will the 2026 El Niño be?
NOAA’s Climate Prediction Center and the IRI ENSO plume put the odds of the 2026–27 event reaching “very strong” at about 88%, with the peak expected around Nov 2026 – Jan 2027. The exact strength is still a forecast and is updated as new outlooks are issued.
When will the 2026 Super El Niño peak?
El Niño events typically peak in late fall to winter. The 2026 event is forecast to peak around Nov 2026 – Jan 2027, with impacts on U.S. weather most pronounced through the winter and into early spring.
How will El Niño affect my area?
It depends on your region. Broadly, El Niño brings a wetter, stormier winter to California, the Southwest, the Gulf Coast and Southeast, and a milder, drier winter with less snow to the Pacific Northwest, the northern tier and the Great Lakes. Enter your city on ElNinoImpact.com for a local rainfall, hazard and preparedness forecast.
Is El Niño the same as climate change?
No. El Niño is a natural, recurring climate pattern that oscillates every few years as part of the El Niño–Southern Oscillation (ENSO). It is separate from long-term, human-driven climate change - though the two can compound, and a strong El Niño year often coincides with record global temperatures.
Where does this forecast data come from?
Strength readings use NOAA’s Oceanic Niño Index (ONI); the “very strong” probability comes from the NOAA Climate Prediction Center and IRI seasonal outlooks; and local weather uses the U.S. National Weather Service and Open-Meteo. Regional impact summaries are grounded in NOAA’s documented El Niño winter signals.
Get a local rainfall, hazard and preparedness forecast for your city.